View Network Stats
As a network manager on a Pressbooks network, you have access to interactive graphs designed to provide you with deeper insight into how your network has been used over time. Data from these graphs can now be directly downloaded as CSV files. Find your network’s Stats page by clicking ‘Stats’ from your Administer Network dashboard.
Page View & Download Data
You can download a CSV file with information on visitors, page views and downloads for all books on your network over a specified time range. This draws from Analytics data using our built-in integration with the open source Koko Analytics plugin; more information on Analytics can be found here. All book download formats are counted individually along with total downloads. More information on making books available for download can be found here.

View Users Over Time
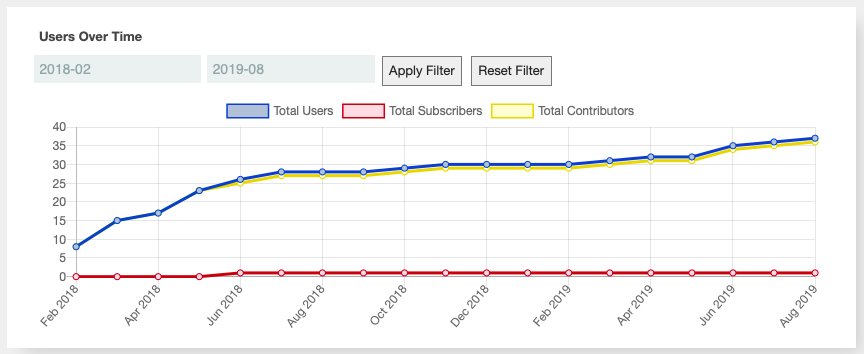
This Users of Time chart provides an interactive view of the number of users on your network over time. By default, the chart displays the full timeline of your network, from the month of its creation to the most recent month. Lines representing total users, total subscribers, and total contributors on the network will show, charted according to growth or decrease over time.
Adjust the Date Range Shown
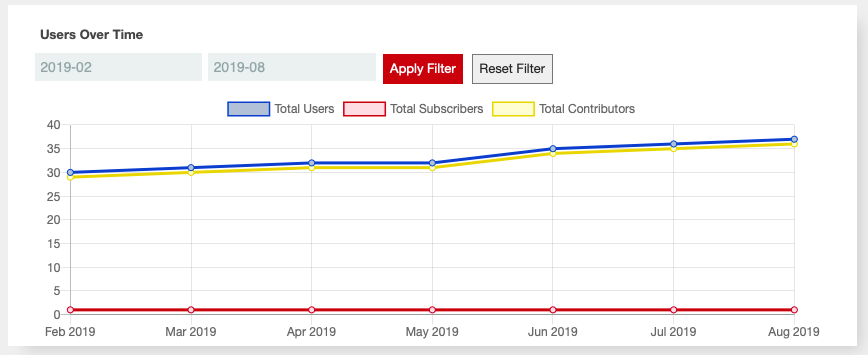
You can change the duration depicted in the visualization by applynig start or end date filters. For example, you could limit the users over time graph to show you growh between February and August of 2019 by entering a start date of 2019-02 and an end date end date to 2019-08 and clicking ‘Apply Filter‘. The chart will be dynamically updated to present only the data for the time frame you’ve chosen. To reset the chart to its default time frame, click the Clear Filters button.
Adjust the Types of Users Shown
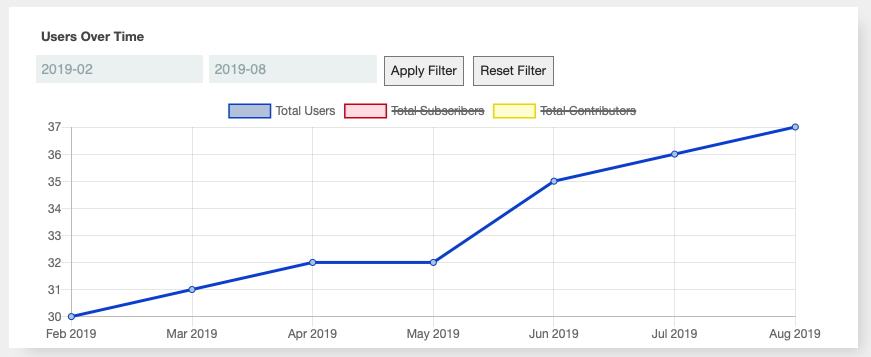
By default, this visualization will show you values over time for three data points: Total Users (a count of all users with accounts on your Pressbooks network), Total Subscribers (a count of all users whose highest role is that of subscriber), and Total Contributors (a count of all users who is a contributor or greater it at least one book). You can choose to hide or show any of these three values in this chart by clicking on the labels.
For example, to remove the line representing total contributors, click the yellow label for Total Contributors that sits above the chart. The Total Contributors label will be crossed out, and the corresponding yellow line will disappear from the chart. Just click the label again to have it reappear on the chart. The chart will changes as you interact with the labels.
Having this information can be helpful for things like:
- Knowing how quickly your Pressbooks network is gaining users
- Knowing what months people are most likely to register for a Pressbooks network, if you’ve enabled self-registration
- Knowing roughly how many students at your university are using a Pressbooks textbook via LTI as a subscriber
- Being able to demonstrate that usage of your Pressbooks network is increasing
Books Over Time
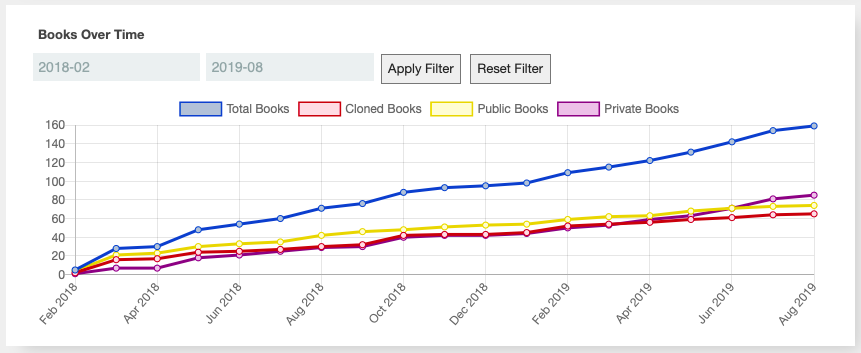
The Books Over Time chart provides you with a visualization of all the books on your network and how that number has changed over time. By default, chart displays all data from your initial network setup up until the present day. The different types of books measured include total books, cloned books, public books, and private books.
Adjust the Date Range Shown
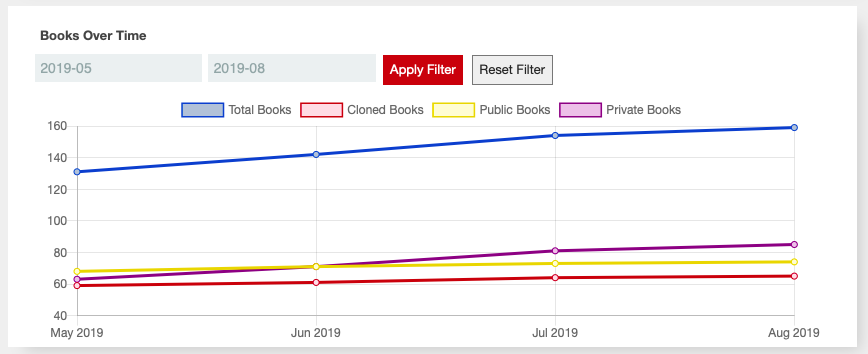
Enter a desired start and/or end date and click ‘Apply Filter‘. The chart will resize to show you the data for the timeframe you’ve chosen. Click ‘Reset Filter‘ to remove any date limitations you’ve put in place.
Adjust the Types of Books Shown
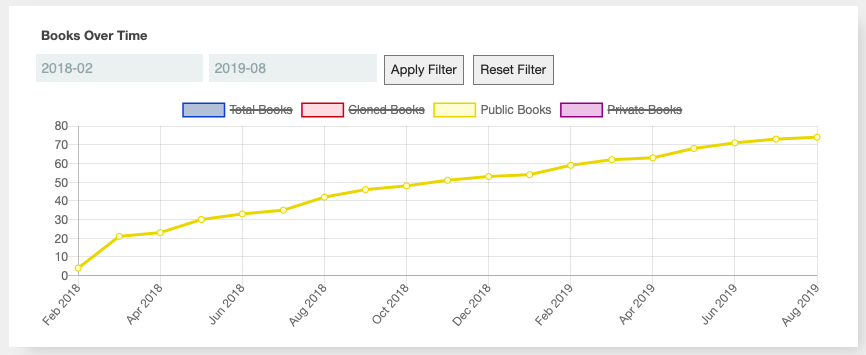
By default, this visualization will show you values over time for four data points: Total Books (a count of all the books which exist on your Pressbooks network), Cloned Books (a count of all books which were created via the Pressbooks cloning routine), Public Books (a count of all books whose global privacy status is set to public), and Private Books (a count of all books whose global privacy status is set to public).
As with the Users Over Time chart, you can select which data you want to see. To remove a line, select its label above the chart. Any selected label will become crossed out, and its corresponding data will be removed from the chart. To make a hidden set of values reappear, simply reselect the label from above the chart.
Having this data available as an easy-to-reference visualization can be helpful for things like:
- Knowing what proportion of books are adaptations (clones) versus original works
- Knowing what proportion of the books on the network are still in progress and not yet presented to the public
- Being able to demonstrate the growth of your network’s usage over time
View User Activity Over Time
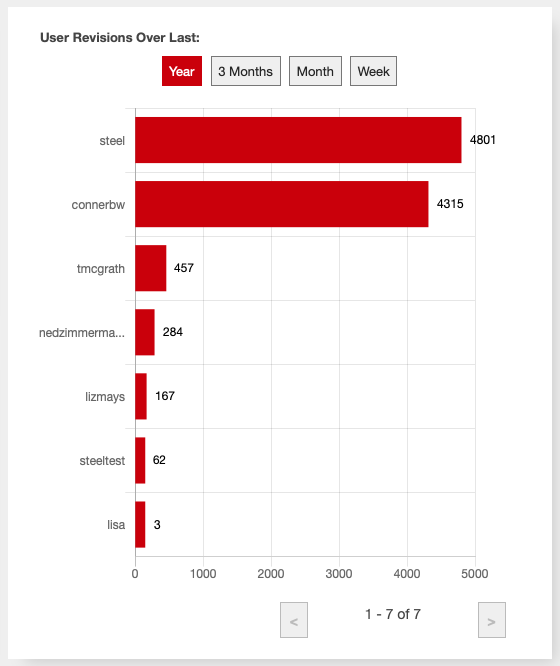
The ‘User Revisions Over Last‘ chart allows you to see which users on your network have been most active over a given time frame. You can choose to view results in any of the following periods of time: the past year, the past 3 months, the past month, or the past week.
By default, the chart will show revisions revisions from over the last year in descending order of quantity. You can change this time frame by clicking the buttons above the chart. Use the navigation arrows at the bottom of the chart to view subsequent results. You can click the red bar that represents the total number of a user’s revisions to be taken to that person’s User Info page.
This chart can be helpful for things like:
- Seeing which users are working on active projects so that you can make offer them appropriate support and resources
- Tracking which users associated with published projects are adding new content so that you know when new editions need to be exported and be made available to the public
- Knowing who the Pressbooks “superusers” are at your institution
View Network Storage
The Network Storage chart allows you to see the amount of storage space used on the network by books relative to each other. Books which make up at least 1% of the total amount of your network’s current storage are represented in the tree map. The area of each block is proportional to its storage size relative to others books, meaning that the larger a block is in relation to other blocks, the more storage that book uses relative to those other blocks/books. Hover over a block on the chart to see that book’s title, total size, and the percentage of space it takes in proportion to other books on the network.
Click a block to be taken to that book’s media library, where you can view what images, videos, and other media have been added to the book.
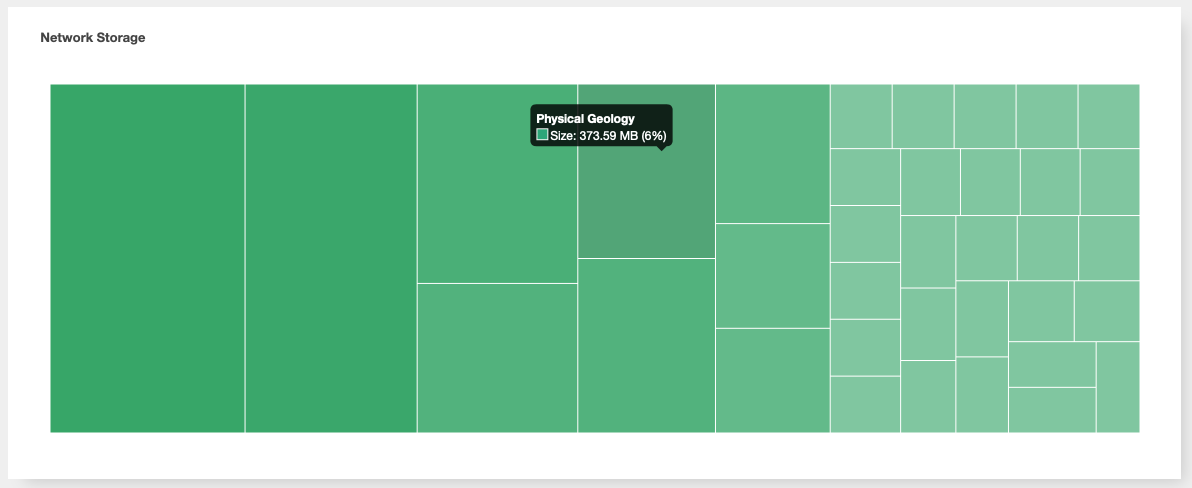
This chart can be helpful in any of the following cases:
- Checking larger books on the network to make sure that media is being uploaded responsibly
- Getting an idea of the size of the average book on your network
- Making comparisons between the average size of books from various disciplines or with a variety of exports
View Most Cloned Books
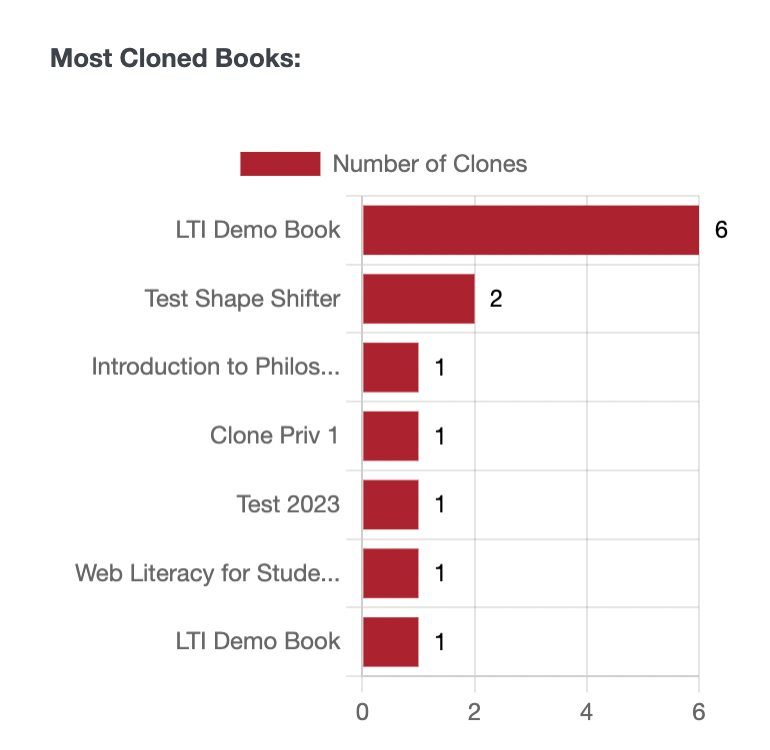
The ‘Most Cloned Books’ chart allows you to see which books on your network have the highest number of clones to date.
